We're a 3-Person Tech Team Running Production Kubernetes — So We Built an AI SRE
We build a decentralized data platform. Client data never leaves their infrastructure — that's the promise. To deliver it, we run five Kubernetes clusters across multiple Scaleway regions, each with its own PostgreSQL, MinIO, Qdrant, Argo Workflows, and a FastAPI data service. Cross-cluster communication runs over mTLS through Skupper. Deployments go through ArgoCD GitOps pipelines.
It sounds like the infrastructure of a company with a platform engineering team. We don't have one. We're three people.
When a pod crashes at 3am, it's the CTO's phone that buzzes. When an ArgoCD sync fails during a client demo, there's no on-call rotation — there's just whoever notices first. We run production infrastructure for real clients with real data, and the honest truth is that for months, our incident response process was "check Slack, hope it's not serious, investigate and fix."
We needed help. Not a dashboard. Not another alerting rule. An actual pair of hands that could look at an alert, check if it's real, figure out what's wrong, and either fix it or tell us where to look.
So we built one.
The Alert Fatigue Trap
We use SigNoz for observability — traces, logs, metrics, the full OpenTelemetry stack. We've spent the time needed to set up alert rules: high error rates, pod crash loops, ArgoCD sync failures, PVC capacity warnings, latency anomalies, database errors, etc etc.
The alerts work. That's the problem.
Most of them are noise. A test tenant's heartbeat returns a few 401 because someone isn't using the right API key? — probably harmless but we should check it's not an attack. An MCP service creates a 30-second root span because of an Istio timeout — not a latency problem, just how Streamable HTTP works. A dev cluster pod restarts once because it hit a memory limit during a large import — it recovers on its own.
But some are real. And you can't tell which is which from the Slack notification alone. Every alert requires the same first five minutes: SSH into a context, run kubectl get pods, check the logs, look at the traces, see if someone merged something recently. The investigation is repetitive, mechanical, and absolutely necessary.
We were spending hours a week on alert triage. Most of it led to "this is fine, ignore it." The few real incidents got the same delayed response as the noise because we were already fatigued.
What If the Runbook Could Execute Itself?
Every ops team has runbooks. Ours now lives in a CLAUDE.md file — a structured document describing what to do for each alert type. Check pods. Check logs. Check recent MRs. If it's a single pod crashing, restart it. If it's database-related, escalate immediately. Never, under any circumstances, delete an ArgoCD application (we learned that one the hard way — cascade deletion of every managed resource, instant production outage).
We created the runbook over months of debugging, the runbook was good. The problem was that it required a human to read it and execute it at 3am with half a brain.
Anthropic's answer to OpenClaw is that Claude Code just shipped a new feature called channels — the ability to push external events into a running Claude session. Not polling. Not a chatbot you ask questions. A live session that receives webhooks, alerts, and messages and reacts to them autonomously.
We realized: if we can push a SigNoz alert into a Claude session, and that session has kubectl access, git access for code checks, and our runbook as its system prompt — we have an SRE agent.
We built it in a day.
The Architecture
The setup is deliberately simple:
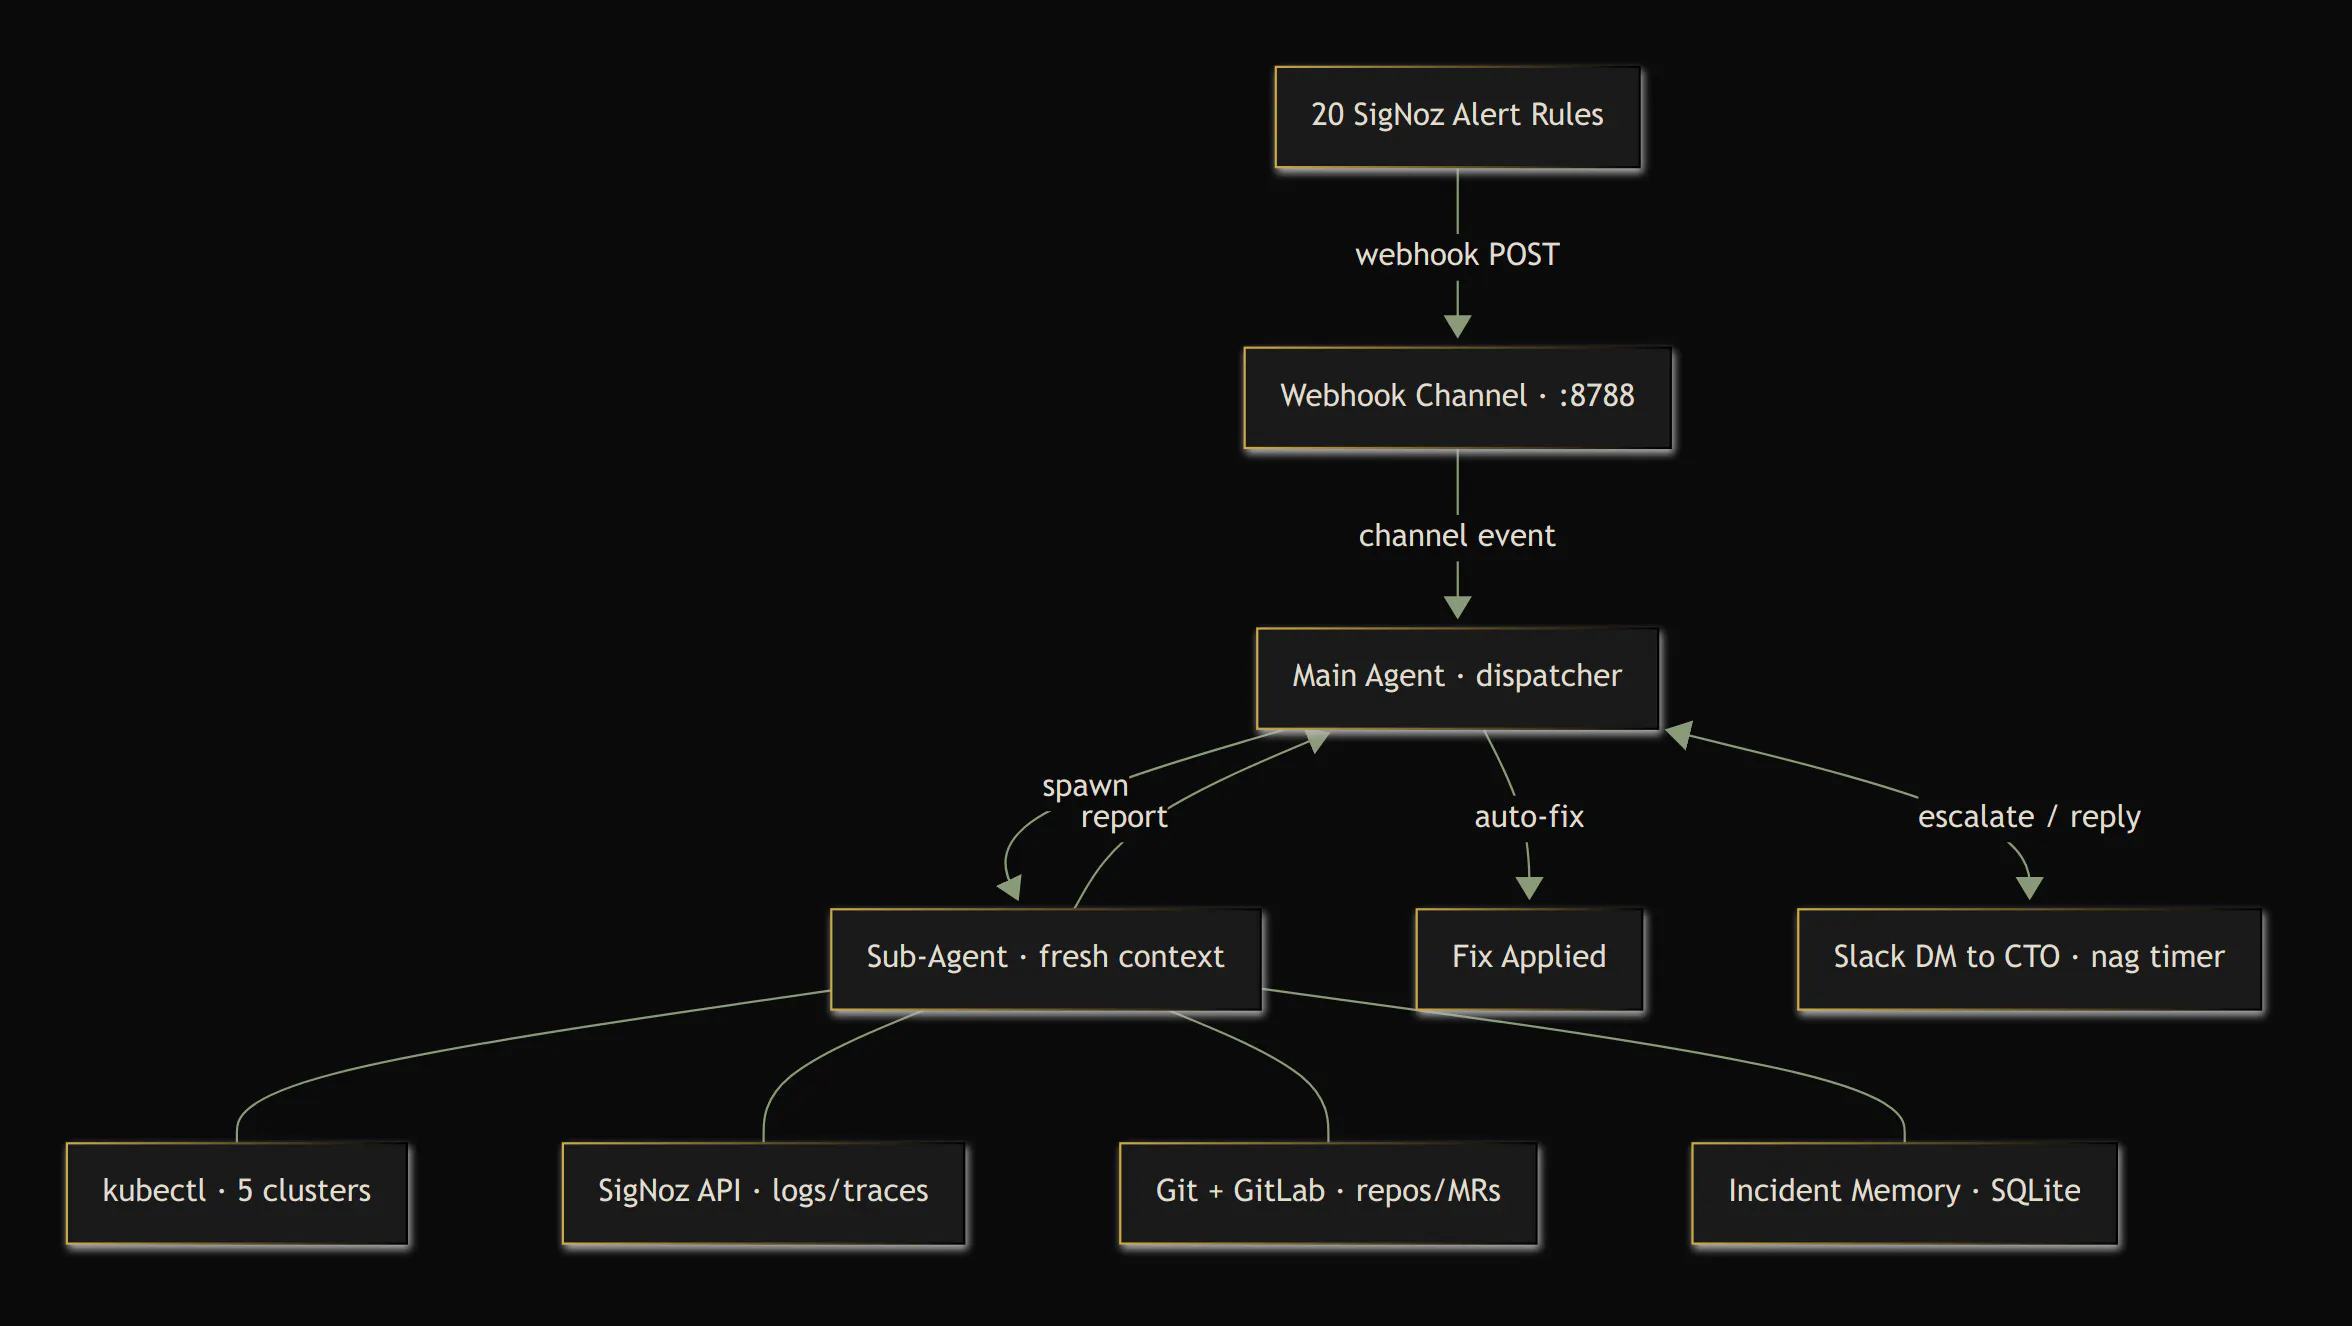
Two custom channel servers handle the I/O:
- The webhook channel listens on port 8788 for SigNoz Alertmanager-format webhooks. When an alert fires, SigNoz POSTs the payload, and the channel parses it into a structured event that arrives in the Claude session with the alert name, severity, service, and cluster as metadata.
- The Slack channel connects via Socket Mode (WebSocket, no public URL needed) and bridges the agent to the CTO's DMs. The agent can send messages, and the CTO can reply — full two-way conversation. It also has a built-in escalation timer: if the agent flags something critical and the CTO doesn't respond within 10 minutes, it nags. And nags again. And again.
The entire infrastructure is a single VM on our cloud provider. Two CPU cores, two gigs of RAM, 6 euro/month.
The Delegation Pattern
Here's the technical insight that made this practical.
A Claude Code session has a context window. Every tool call, every kubectl output, every log dump consumes tokens. If the agent investigates every alert directly, its context fills up within hours, and the session becomes useless.
The solution: the main agent never investigates. It dispatches.
When an alert arrives, the main agent reads the metadata — alert name, severity, service, cluster — and makes a quick filter decision. Resolved alerts get logged and ignored. Known noise (test tenant heartbeats) gets dismissed. Everything else spawns a sub-agent.
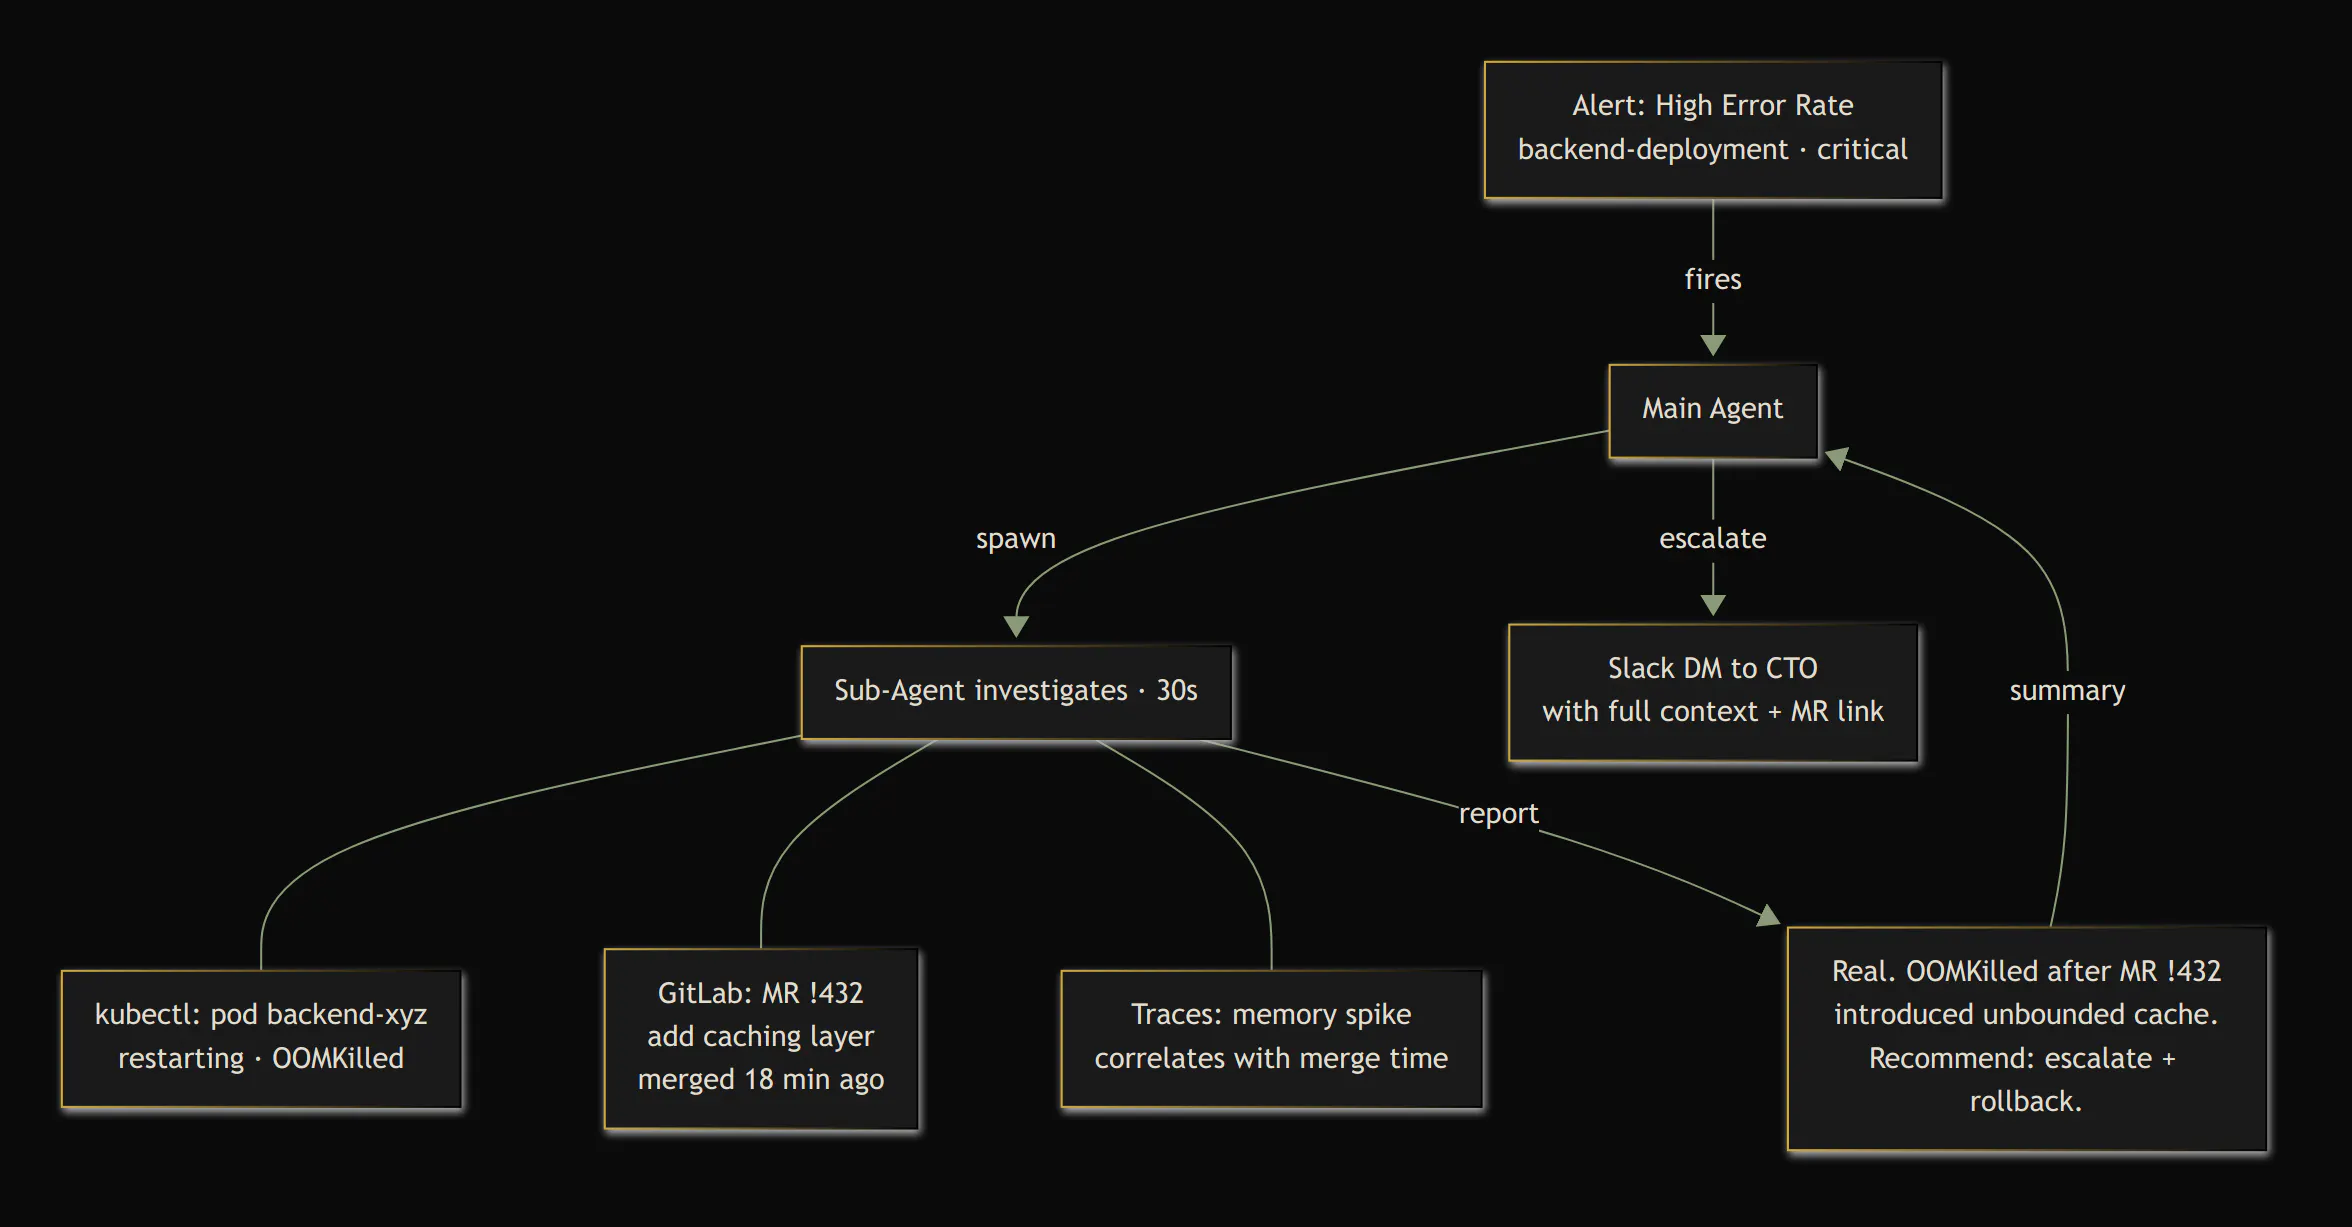
The sub-agent is a fresh Claude instance with its own context window. It gets a detailed prompt: "Investigate this High Error Rate alert on the backend service in the platform-dev cluster. Check pods, check logs, check if an MR was merged in the last hour. Report back: real or false positive, root cause, recommended action."
The sub-agent does all the heavy lifting — runs kubectl commands, queries SigNoz for traces, checks the GitLab API for recent merges, reads git logs. It returns a concise summary. Then it's done. Its context is discarded.
The main agent reads the summary and decides: auto-fix, escalate, or ignore. Its context stays clean. It can run for days.
Teaching It What's Safe
Autonomy without guardrails is a liability. We drew explicit lines.
Safe operations — the agent can do these without asking:
- Restart a deployment (kubectl rollout restart)
- Delete a stuck pod (Kubernetes recreates it)
- Clear a stuck Argo Workflow
- Force-refresh an ArgoCD application
Forbidden operations — hardcoded in the runbook and with kubectl service account RBAC, non-negotiable:
- Never delete an ArgoCD Application (cascade-deletes all managed resources)
- Never delete a namespace, PVC, or secret
- Never touch database operations
- Never scale anything to zero
- Never push to git
Always escalate — requires human judgment:
- Database errors
- Certificate or mTLS failures
- Multiple services affected simultaneously
- Anything the agent doesn't fully understand
- Anything that needs an intervention
The agent also adapts to the environment. On dev clusters, it's liberal — restarts things freely, sends a casual single Slack message if something's weird. On production, it's paranoid — verifies twice, escalates aggressively, and nags every 10 minutes if you don't respond.
RBAC enforces these boundaries at the Kubernetes level. The agent's ServiceAccount can read everything but can only write to deployments (for restarts) and delete pods and workflows. It physically cannot delete an ArgoCD application, even if the runbook instructions were somehow bypassed.
Incident Memory
The agent restarts daily at 4am with a fresh context window. Naive approach: it forgets everything. Our approach: it doesn't.
Every investigation — whether it ended in "noise," "auto-fixed," or "escalated" — gets logged to a SQLite database on the VM. Before a sub-agent investigates anything, its first step is to check the history: "Has this alert fired before? How many times? What was the verdict?"
On startup, the agent receives a briefing generated from the database:
=== SRE Briefing — Last 7 Days ===
Total: 47 alerts | 38 noise | 6 real | 3 auto-fixed | 3 escalated
Recurring noise (consider tuning):
- High Latency on openaire-test | 12x
- Tenant Inactive on tenant-test-* | 8x
Recent real incidents:
- [Apr 17] Pod CrashLooping on backend — auto-fixed: OOMKilled, recovered
- [Apr 16] ArgoCD Out-of-Sync on data-cluster — escalated: bad helm values
Pending escalations (unacknowledged):
- [Apr 16] PVC at 87% on data-cluster-biorxiv — climbing
This changes the agent's behavior. An alert that's been noise twelve times this week gets dismissed instantly instead of spawning a full investigation. An alert that was real last Tuesday gets escalated faster.
And here's the feedback loop that makes the alerting itself get better: when the agent detects recurring noise, it messages the CTO with a concrete tuning proposal. "High Latency on openaire-test has fired 12 times in 7 days and was noise every time. Proposal: increase the eval window from 10 minutes to 20, or switch to anomaly detection." The alert configuration improves itself over time, automatically.
The First Day
The agent went live on a Wednesday afternoon. Within minutes, it was processing real alerts.
The first thing it did was correctly dismiss a batch of "High Latency" alerts on test services as transient noise. No investigation needed, just pattern recognition from the runbook — exactly what we'd do manually, except we wouldn't have gotten to it for an hour.
Then it caught an ArgoCD App Out-of-Sync on a data cluster. It spawned an investigation sub-agent, determined it couldn't auto-fix (sync failures need human review of the git diff), and escalated to Slack. With full context: what it checked, what it found, and what it recommends.
The CTO was in a meeting. The agent nagged. Ten times over the next two hours. "Still unacknowledged. Nag #7." "CTO has been unreachable for 90 minutes." It's relentless. It doesn't get distracted, forget, or decide it's probably fine.
When the CTO finally replied on Slack — from his phone, mid-meeting — the conversation continued in-thread. "What changed in the last deploy?" The agent checked. Two-way, asynchronous incident response from a phone screen.
What surprised us most: the agent correctly identified that tenant-test-* namespaces are test environments with known heartbeat issues, even though we only described this in a single line of the runbook. It never investigated those alerts. It just logged "known issue, ignoring" and moved on.
The Numbers
The VM costs €6.50 per month. The agent runs on our existing Claude Team subscription — no per-call API costs, no metered pricing, no surprise bills. The marginal cost of the SRE agent is literally the VM.
For context, Datadog's Watchdog AI investigations cost $800 per 20 investigations — $40 each — and they give you a summary of what might be wrong. You still have to SSH in and fix it yourself. At our alert volume, we'd burn through a pack in a couple of days.
But the comparison misses the point. We weren't choosing between our agent and Datadog. We were choosing between our agent and nobody. The realistic alternative for a startup our size isn't a $40-per-investigation enterprise product. It's "nobody looks at alerts until something breaks badly enough to page someone."
The real value isn't in the cost. It's in the incidents that get caught at 3am instead of festering until morning. It's in the CTO not having to context-switch out of a client meeting to investigate noise. It's in sleep and peace of mind.
Build Your Own
The pattern is generic. You need three things:
- An Alertmanager-compatible monitoring tool (SigNoz, Prometheus, Grafana — anything that sends webhooks)
- Claude Code with channels (push events into a running session)
- A small VM (anything that can run Node.js and kubectl)
The webhook channel is about 80 lines of TypeScript. It receives the POST, parses the Alertmanager payload, and pushes it into the Claude session as a channel event. That's it.
The Slack channel is more involved — Socket Mode connection, reply tools, permission relay, escalation timer — but the core is the same pattern: receive events from the outside world, push them to Claude, let Claude call tools to respond.
The runbook-as-code approach is the key insight. If you have a runbook — even an informal one in someone's head — you can write it as a CLAUDE.md. The format doesn't matter. What matters is being explicit about:
- What to check for each alert type
- What's safe to fix automatically
- What requires a human
- How urgently to escalate
Our agent's runbook is about 350 lines of core rules, backed by a dozen alert-specific playbooks that sub-agents load on demand. The playbooks live as separate files — the main agent's context only carries the dispatch logic, not every kubectl command for every alert type. It took an afternoon to write. It executes 24/7.
The full source is open: https://github.com/the-alien-club/ai-sre
What's Next
We're looking at having the agent create Jira tickets for recurring patterns. Not just escalate to Slack — actually document the issue, link the relevant MRs, and assign it for follow-up.
The dream, eventually, is proactive detection. The agent already has access to metrics, traces, and logs. In theory, it could notice a slow memory climb or a gradually increasing error rate before the alert threshold is reached. We're not there yet, but the infrastructure is.
For now, we have something that didn't exist last week: an SRE that never sleeps, never gets alert fatigue, and costs less than a team lunch. For a three-person startup running production Kubernetes, that's not a nice-to-have. That's survival.